
Using matrixes to help plot your most important features in your strategic timeline
Whether you’re working on a large, medium, or small-sized project, knowing your priorities and how-to strategies for their completion is key to an on-time, and within-budget delivery.
Despite how important knowing how to create a strategic roadmap to project completion is, Hello Human has seen many instances where this has been done incorrectly.
What we’ve noticed is that it’s very easy for project managers to fall into the trap where everything you select has a "High value" and is "Needed now". This creates an unworkable environment where priorities cannot be properly set.
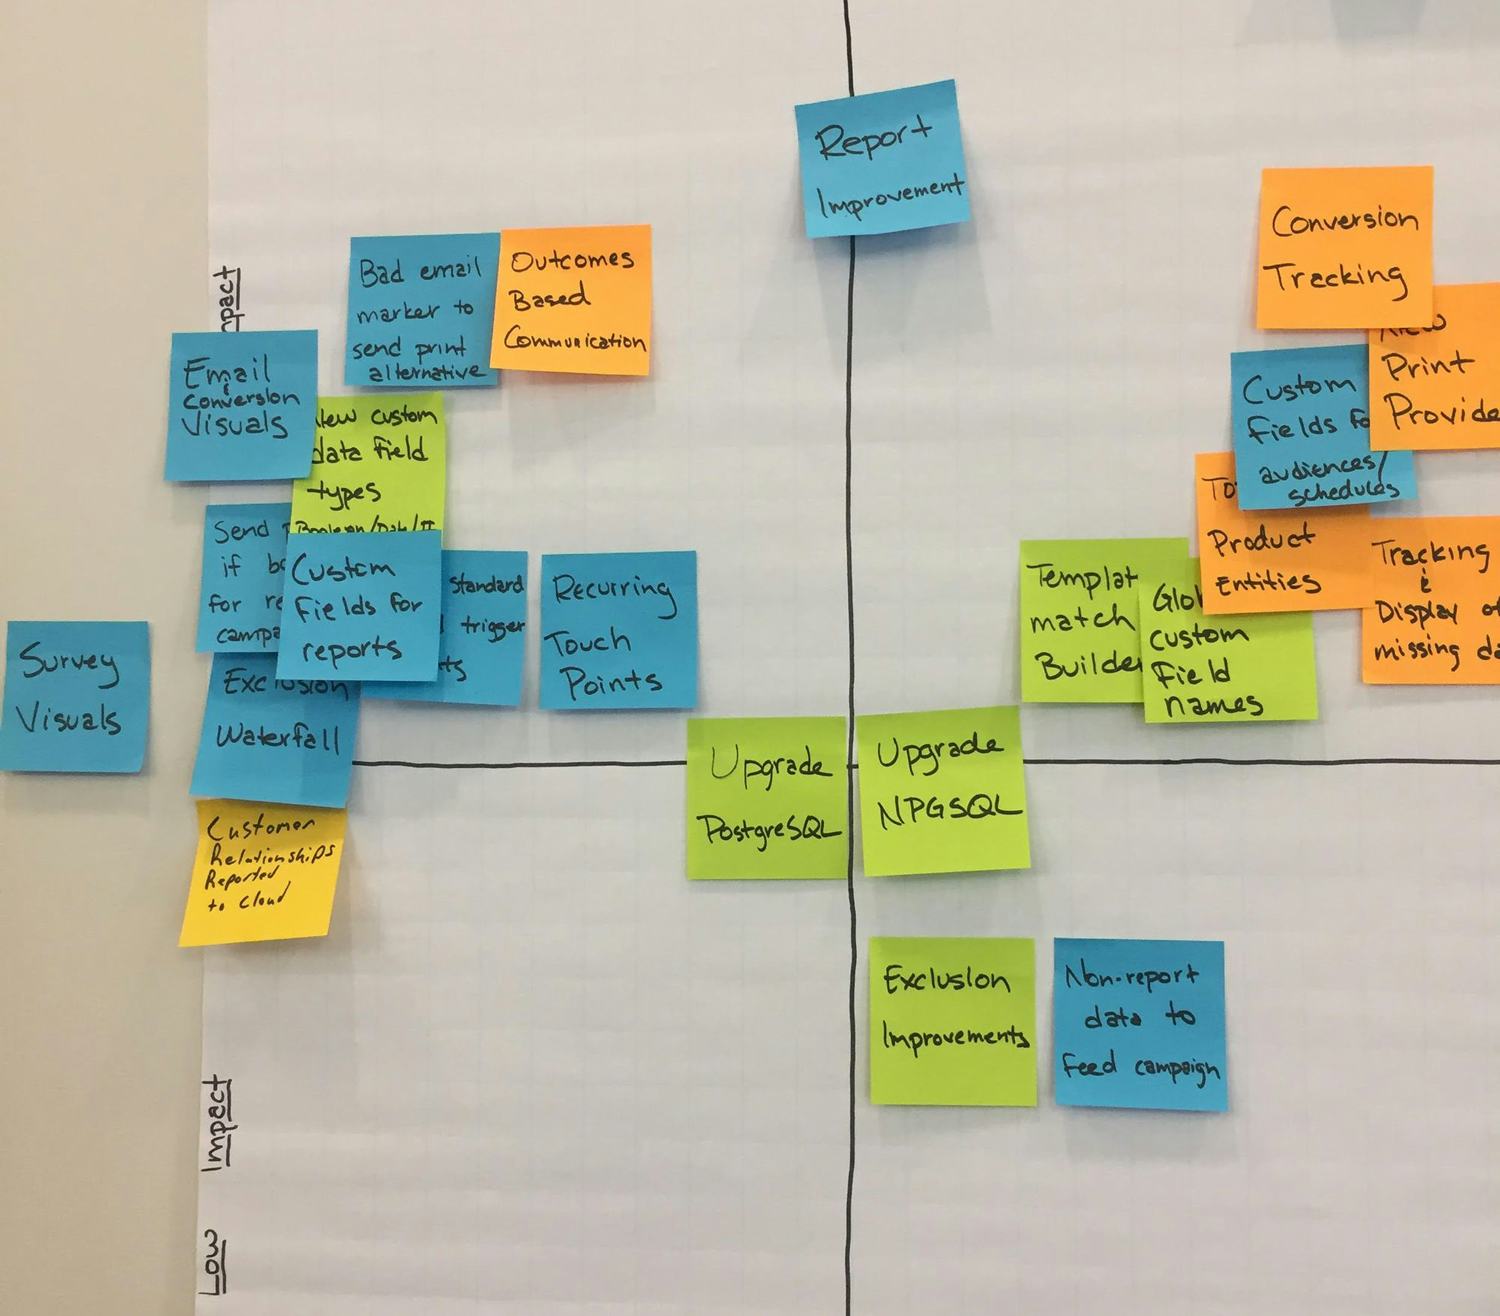
Through years of client work, the Hello Human team has designed both a strategy and a template to better assist teams to plot their strategic roadmaps to hit project goals. We base our template on a robust Value/Risk matrix. This guides teams to plot project items on a map, all in relation to each other so that your team can discuss the plan. This enables your team to share their thoughts on each item’s value and the risk of it not being done now OR not being done correctly.
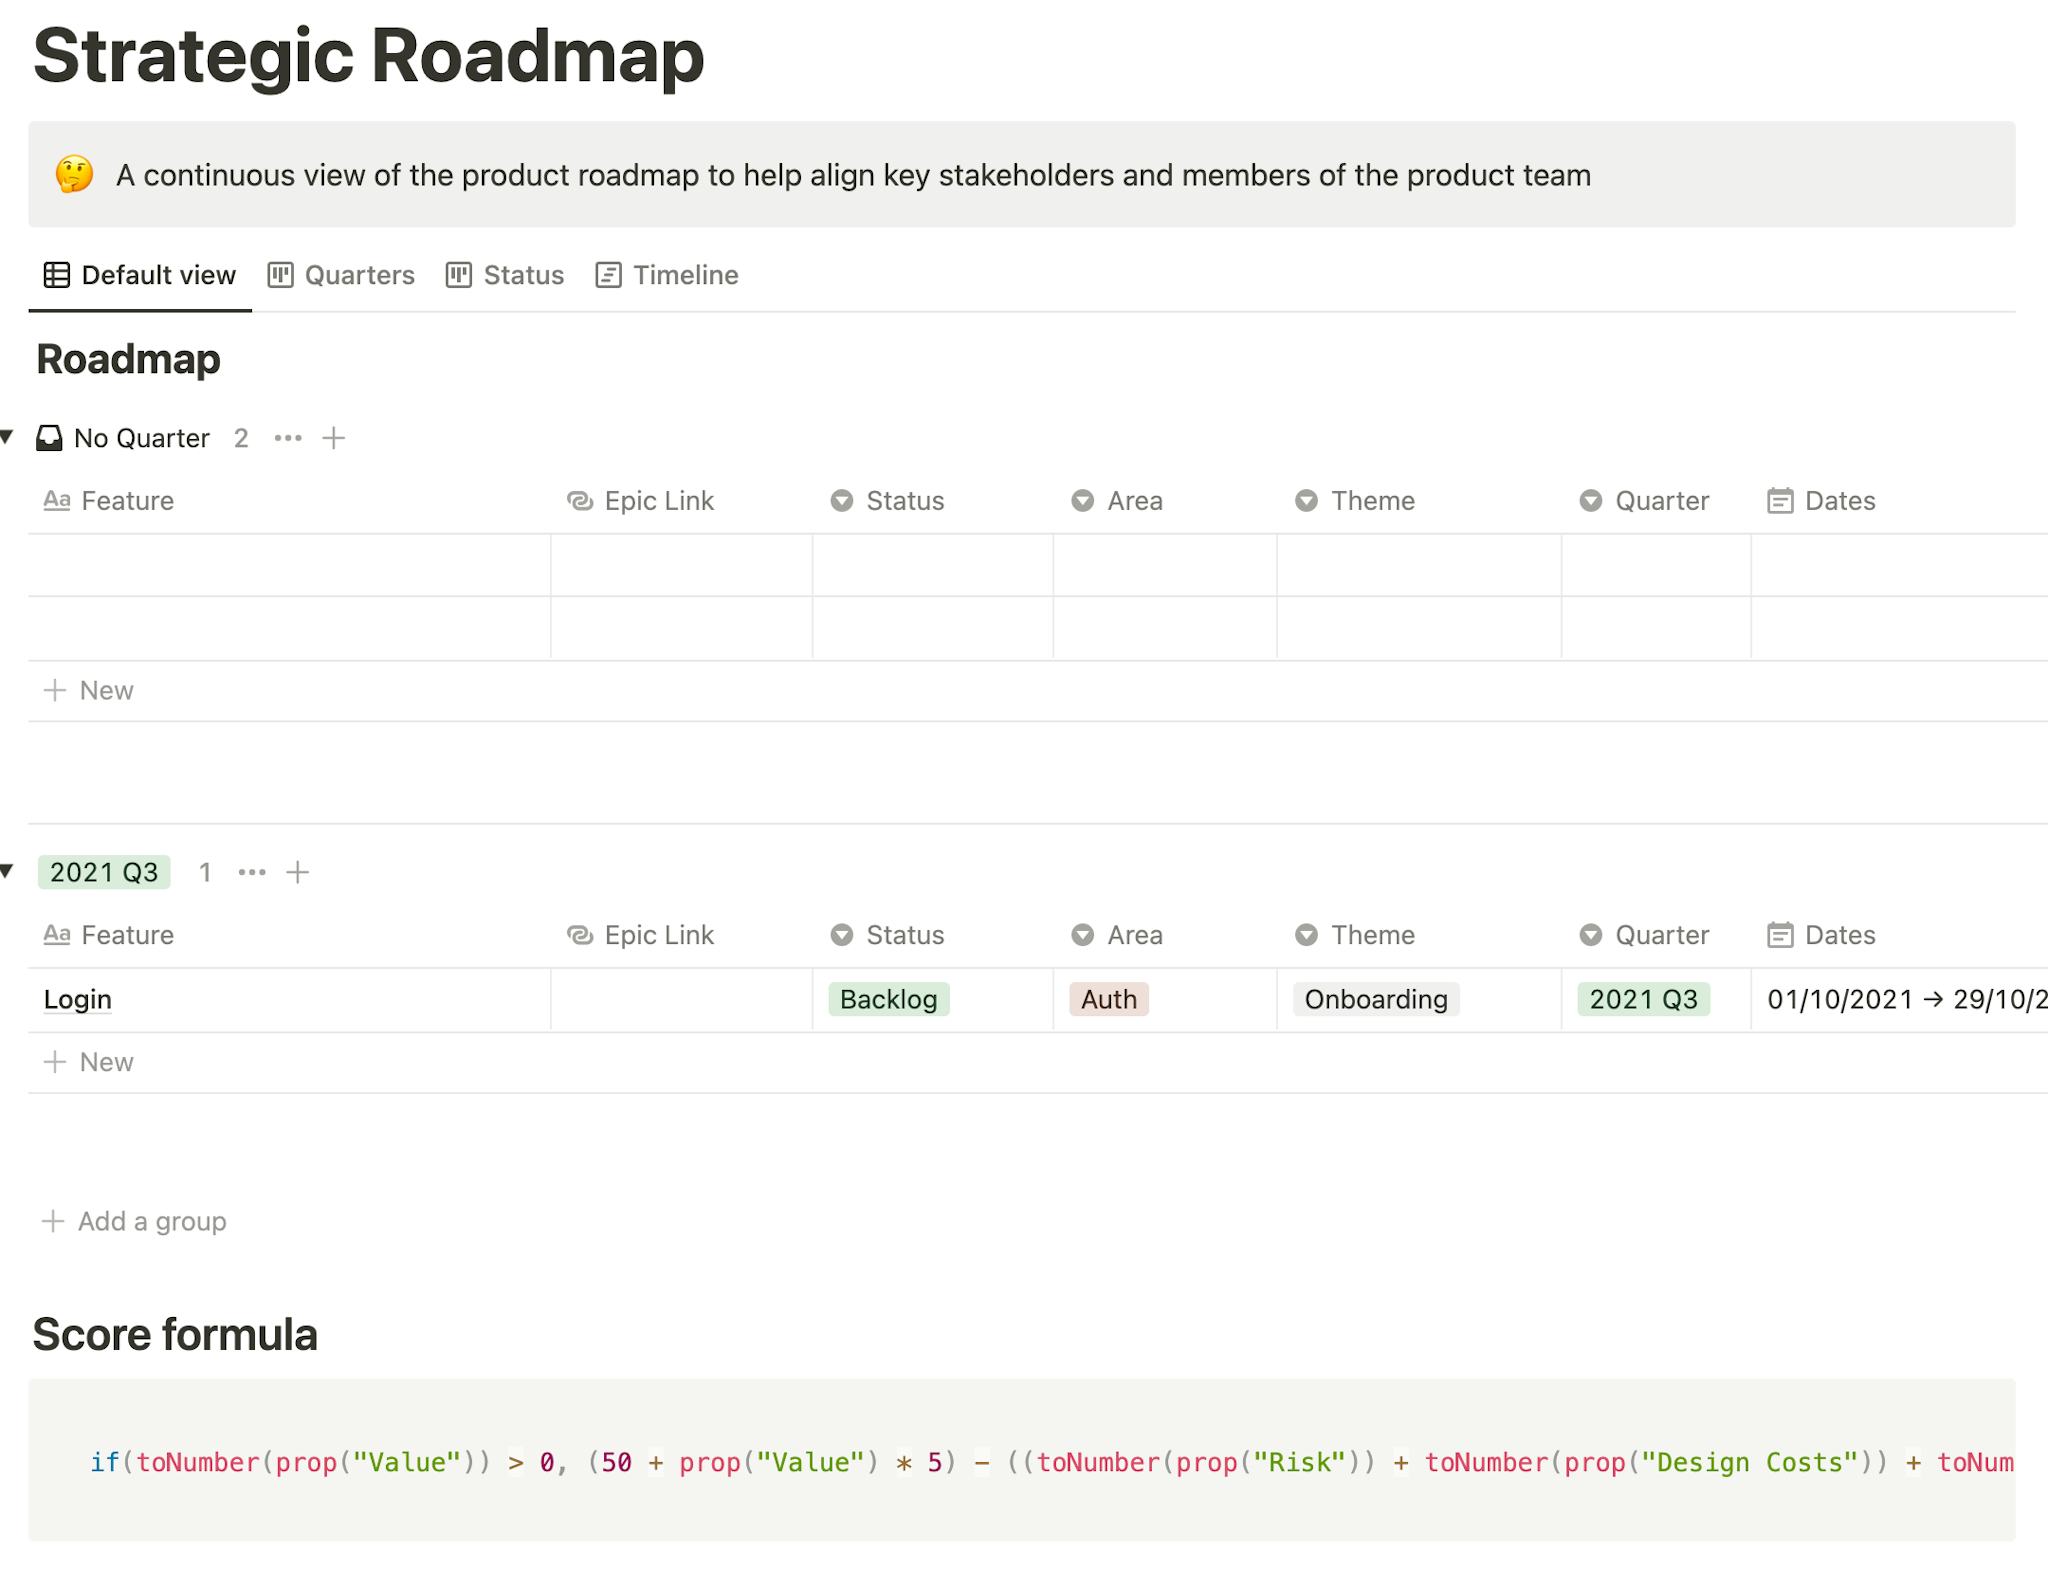
So how does our template work? Well, you can start to break down your high level "Epics" and, using our strategic roadmap, start to assign each item the following:
Status; where each item is
Backlog / In Progress / Done.
We don't want to replicate your development boards, remember these are supposed to be a high-level indicator of progress
Area; what area of the platform or product does this belong to. This can be feature-based if needed.
Theme; what theme or category does this area of work roll up to? We know that themes are super helpful for your team’s OKR tracking.
Quarter; when do you think this should be delivered?
The next step, using your mapping matrix, should be breaking down the epic's value, risk and the effort to deliver it. The template will guide you through key points for consideration, such as:
Risk: What is the risk of this not being done or not being done right?
Design Costs (story points): What effort is required of the design team?
Development Costs (story points): What effort is required of the development team?
Maintenance Costs (story points): What effort would be required of the maintenance or support team after it's gone live?
Human resources (story points): What effort could this put on the Human resource teams for hiring or growth to get this completed?
Confidence (Out of 100): How confident are we in these numbers? These can be pretty vague t-shirt sizing effort scores so be honest. If the score is low then it's definitely time for some Discovery and tech spikes.
Our template will take all of this data and produce a score out of 100 that can be automatically grafted onto a more granular Map.
Remember: this is a guide to get you started. This is not something to be done once and then forgotten. This process should be continuously assessed and updated whenever new knowledge is obtained or estimates are more detailed.
What’s Next?
If you’ve read through this and are interested, then we’ve got some great news for you: our template is in testing mode and you can get a copy to try it out for free! Head on over to our template and feel free to make a copy for your own use. Give it a try, and then let us know how you went, if you have any suggestions we welcome all feedback.