Digitising farming with design thinking and mixed method research.
When one thinks of a livestock farmer, “digital systems” is not the first thought that comes to mind. There have been many efforts made in the past to innovate and digitise how livestock farmers track and manage the livestock lifecycle on their farms. The vast majority of these efforts, which were mainly centred around the transformative process of taking a manual paper-based process to digital, were not received well by the most important feedback group: the farmers themselves. However, when design thinking and research are applied: can better systems and platforms be developed to support our livestock farmers?
As part of this work our Hello Human team investigated these previous efforts to find out why the process of digitising how a farmer tracks the lifecycle of their livestock had always failed. From our research we found:
The new digitised process took a very long time to complete, and as it was often left until the last minute it was actually easier for the farmers to resort back to their paper systems
Previous system and platform designers hadn’t built any feedback loops into the process, to better understand current usage or pain points
We discovered that this was due to the teams only designing ‘happy path’ journeys and also not focusing on fundamental parts of the platform, like data validation.
As a result, feedback on the digitisation of farming platforms from livestock groups was negative; there was an overwhelming consensus that they preferred to continue using the manual paper-based solution.
This is where the Hello Human team stepped in, to begin our work to create a new system that not only resonated well with its users but also made their lives easier.
Stage 1: Learning the system
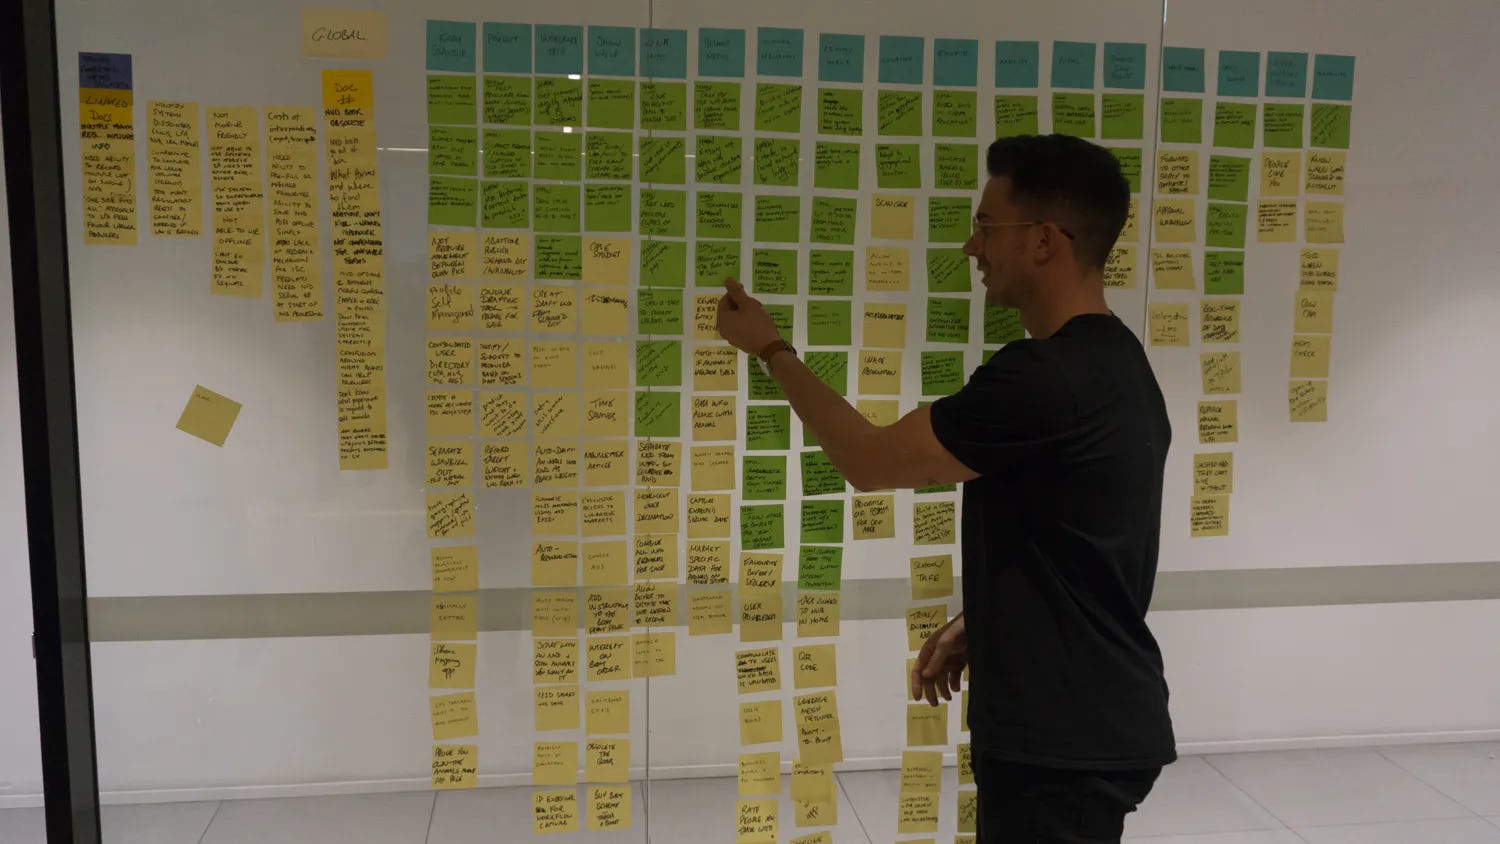
The first step of the design thinking and research process was to familiarise ourselves with the entire current flow of the system. To do this we mapped out the end-to-end process. This was to ensure we were fully across all of the process elements before we conducted our extensive interview.
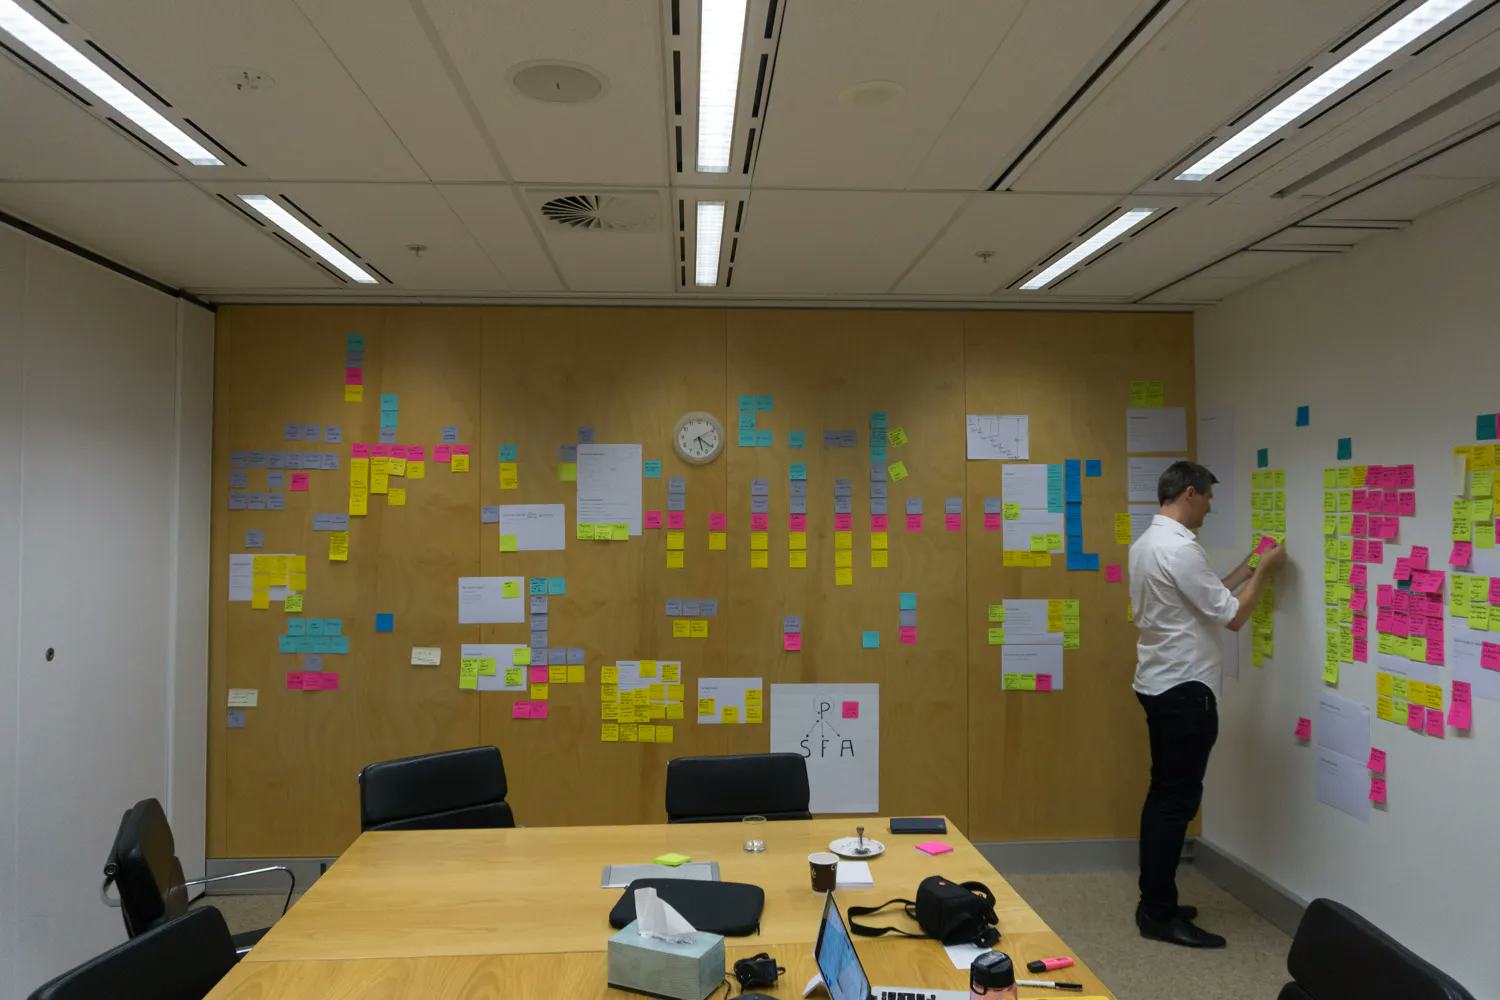
We gathered all of the Hello Human team members into one room and placed post-it notes across an entire meeting room wall to physically map out the process. As we mapped the process our team added in any questions that came up.
Such an in-depth review of the system allowed us to spot some general usability and accessibility issues with the existing process, which we incorporated into later feedback. This also provided valuable insights into where we could improve the process and its efficiency.
Stage 2: Conducting interviews
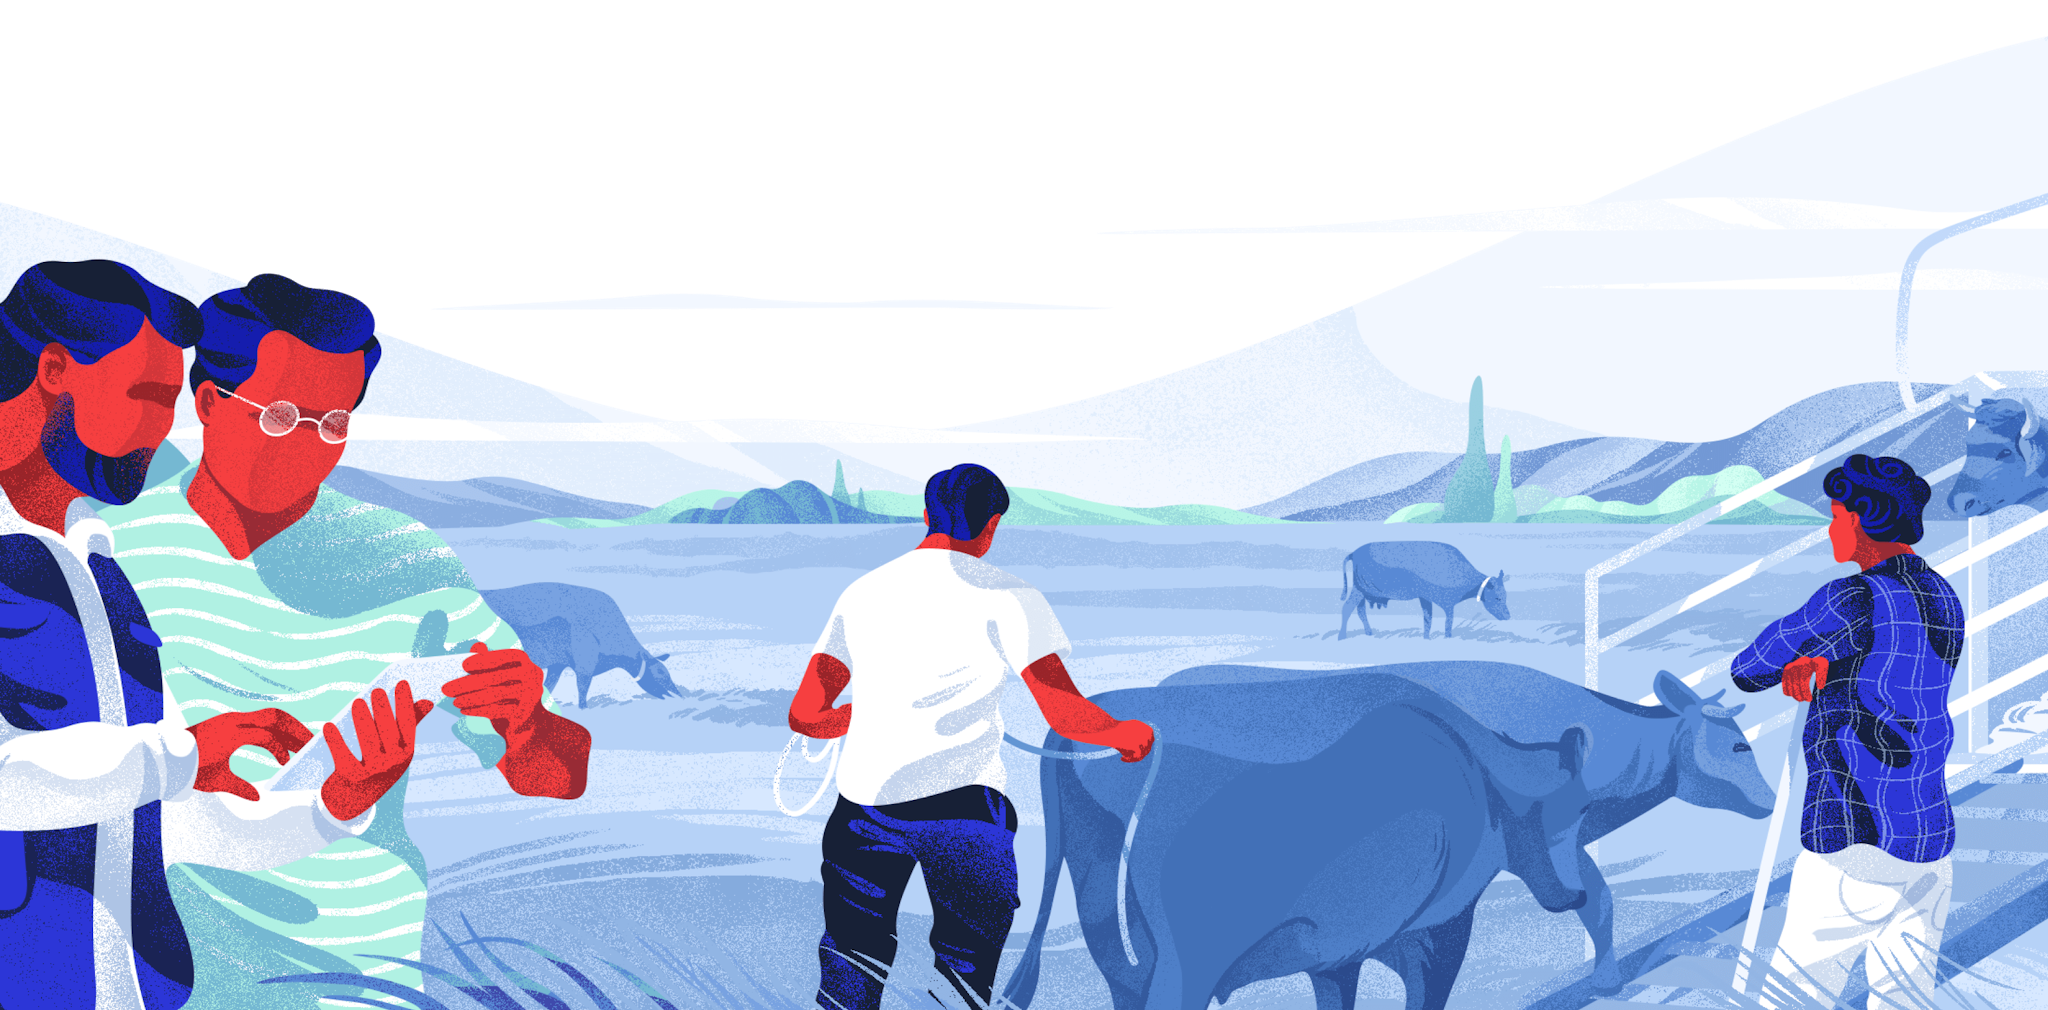
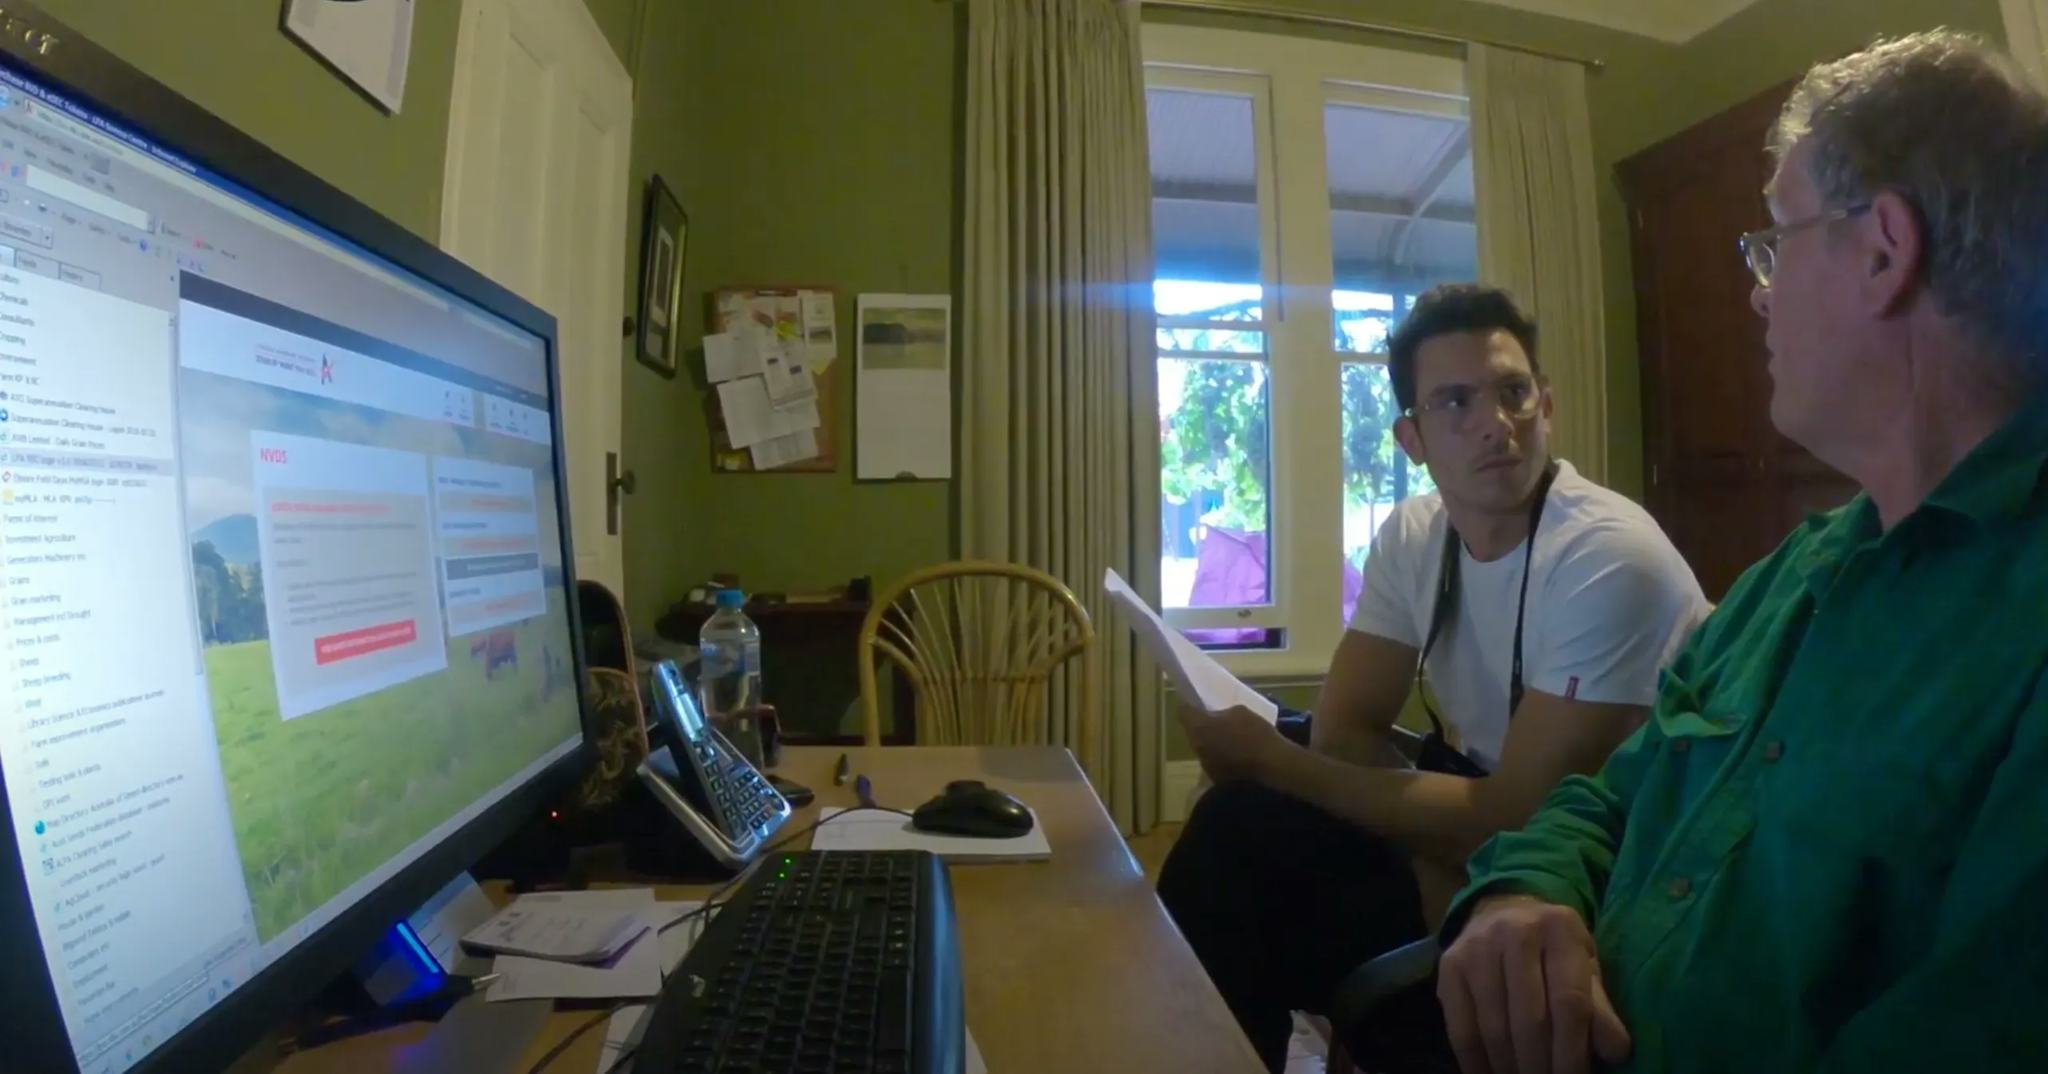
The second stage of our process was to conduct over 20 interviews with different cohorts of system users. Users such as those responsible for the creation of data, for the transfer of data and some for monitoring & acting upon the data. This ensured that we had an as-complete-as-possible data set to build our foundations upon.
Over the span of three months, our team travelled throughout Australia to conduct these interviews. To ensure we obtained all the data relevant to our project we conducted a mix of different ethnographic research (following someone around) in addition to the contextual inquiries (one-on-one interviews).
Though our team members came prepared for a list of pre-defined questions beforehand; a mix of general and system-specific, some of the contextual enquiries were up to 3 hours long. This provided an opportunity to learn about any problems producers have with any systems they currently used in raising and selling livestock.
We collected Audio recordings, video recordings, screen shares and photographs throughout the three-month process to document as much as possible. When required, to ensure a complete capture of data, we transcribed using the service rev.com.
The information gathering in this stage was not just to inform our research; artefacts helped provide visual proof to the client when we handed over the final report and a glossary of references.
Stage 3: Synthesising insights
The third stage of this process was to synthesise insights. For this we used a practice called affinity mapping to organise all of our pieces of data and insights into groups. Every interview we did was transcribed and split into paragraphs in Excel. These paragraphs were then printed off and labelled for sorting.
In total there were 60 hours of transcribed interviews, so this stage took around three weeks. We turned this into a hands-on process, to ensure careful consideration and attention to each data point collected. We opted for a manual process here, printing off the paragraphs to physically stick them up. This was done as it has been proven over and over that reading insights off a piece of paper and physically moving the paper around helps information to stick in the brain much better than if it were read off a laptop screen. However, recent developments (released after we undertook this project) have made it so we can digitise this process, using MIRO or a similar platform.
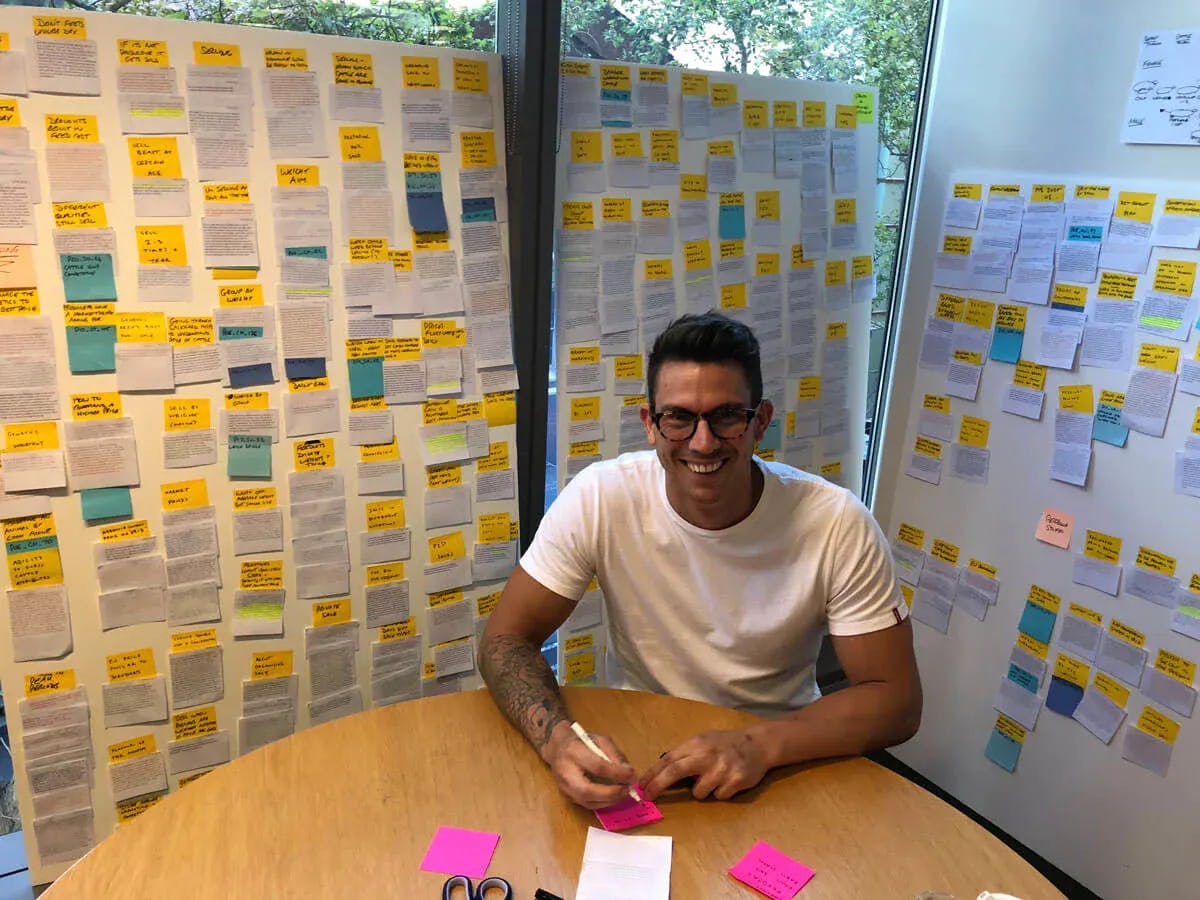
The team summarised each transcribed paragraph with a post-it note and 'bubble up' insights, making summaries of the summaries. This process allowed us to access very clear and easy-to-digest insights, which was key to progress to the next stage.
Stage 4: Presenting findings
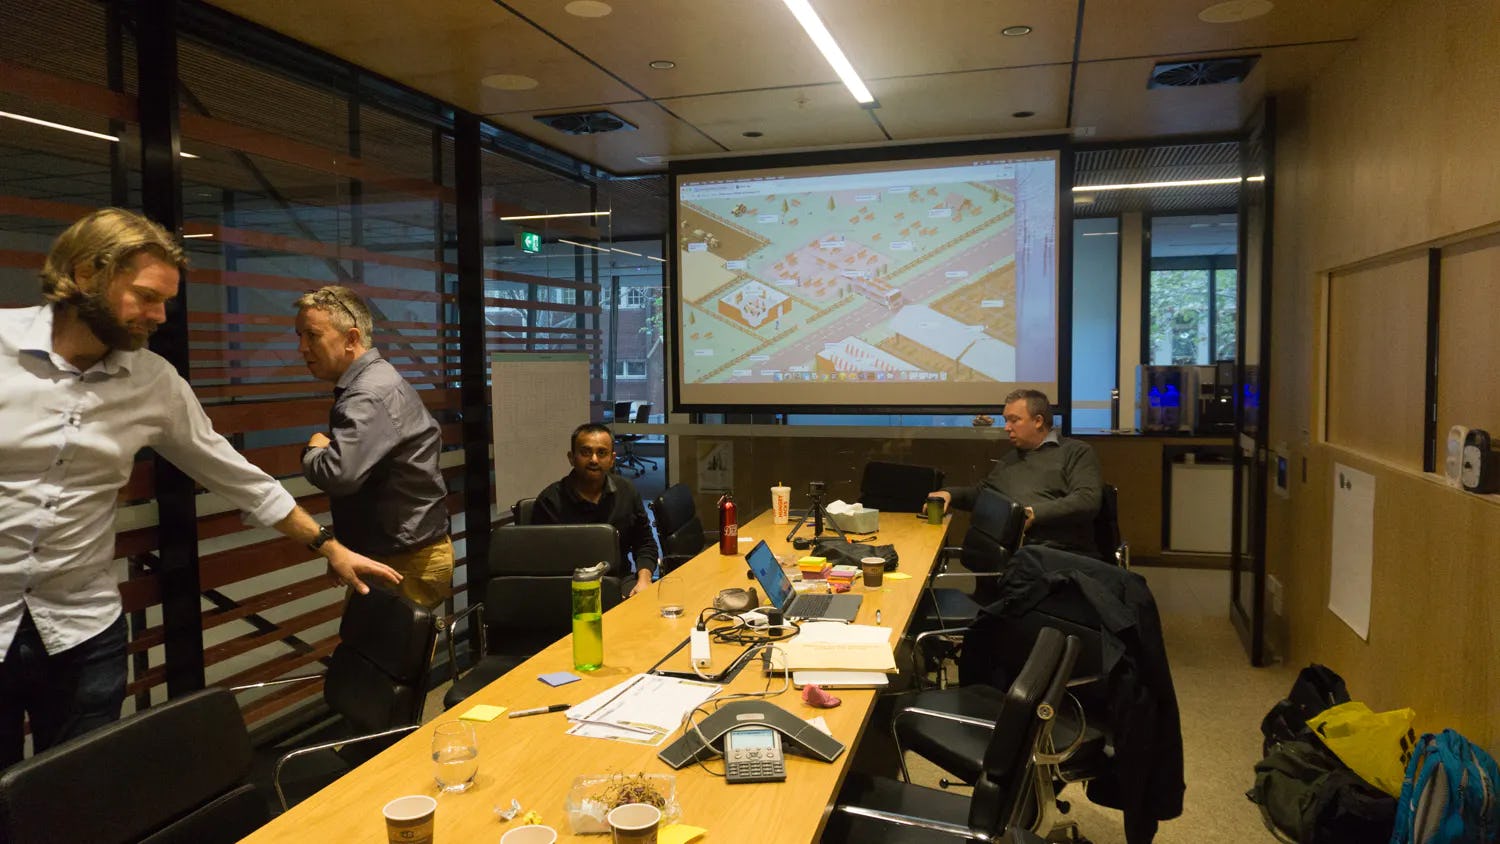
The fourth stage of this process was to present our findings back to those with a vested interest in digitising the process; the farmers themselves. To fully showcase the work done we decided to create posters that outlined the end-to-end process of the livestock's lifespan and the people and the systems they touch, in addition to the final report and the presentation. Each poster overlaid findings from research, inserting them into each respective stage.
In addition to providing confirmation that we really did understand their processes, organising the poster in this way made it very easy for our clients to identify the pain points of any particular stage of a livestock’s lifespan.
Stage 5: Over delivering with an interactive map
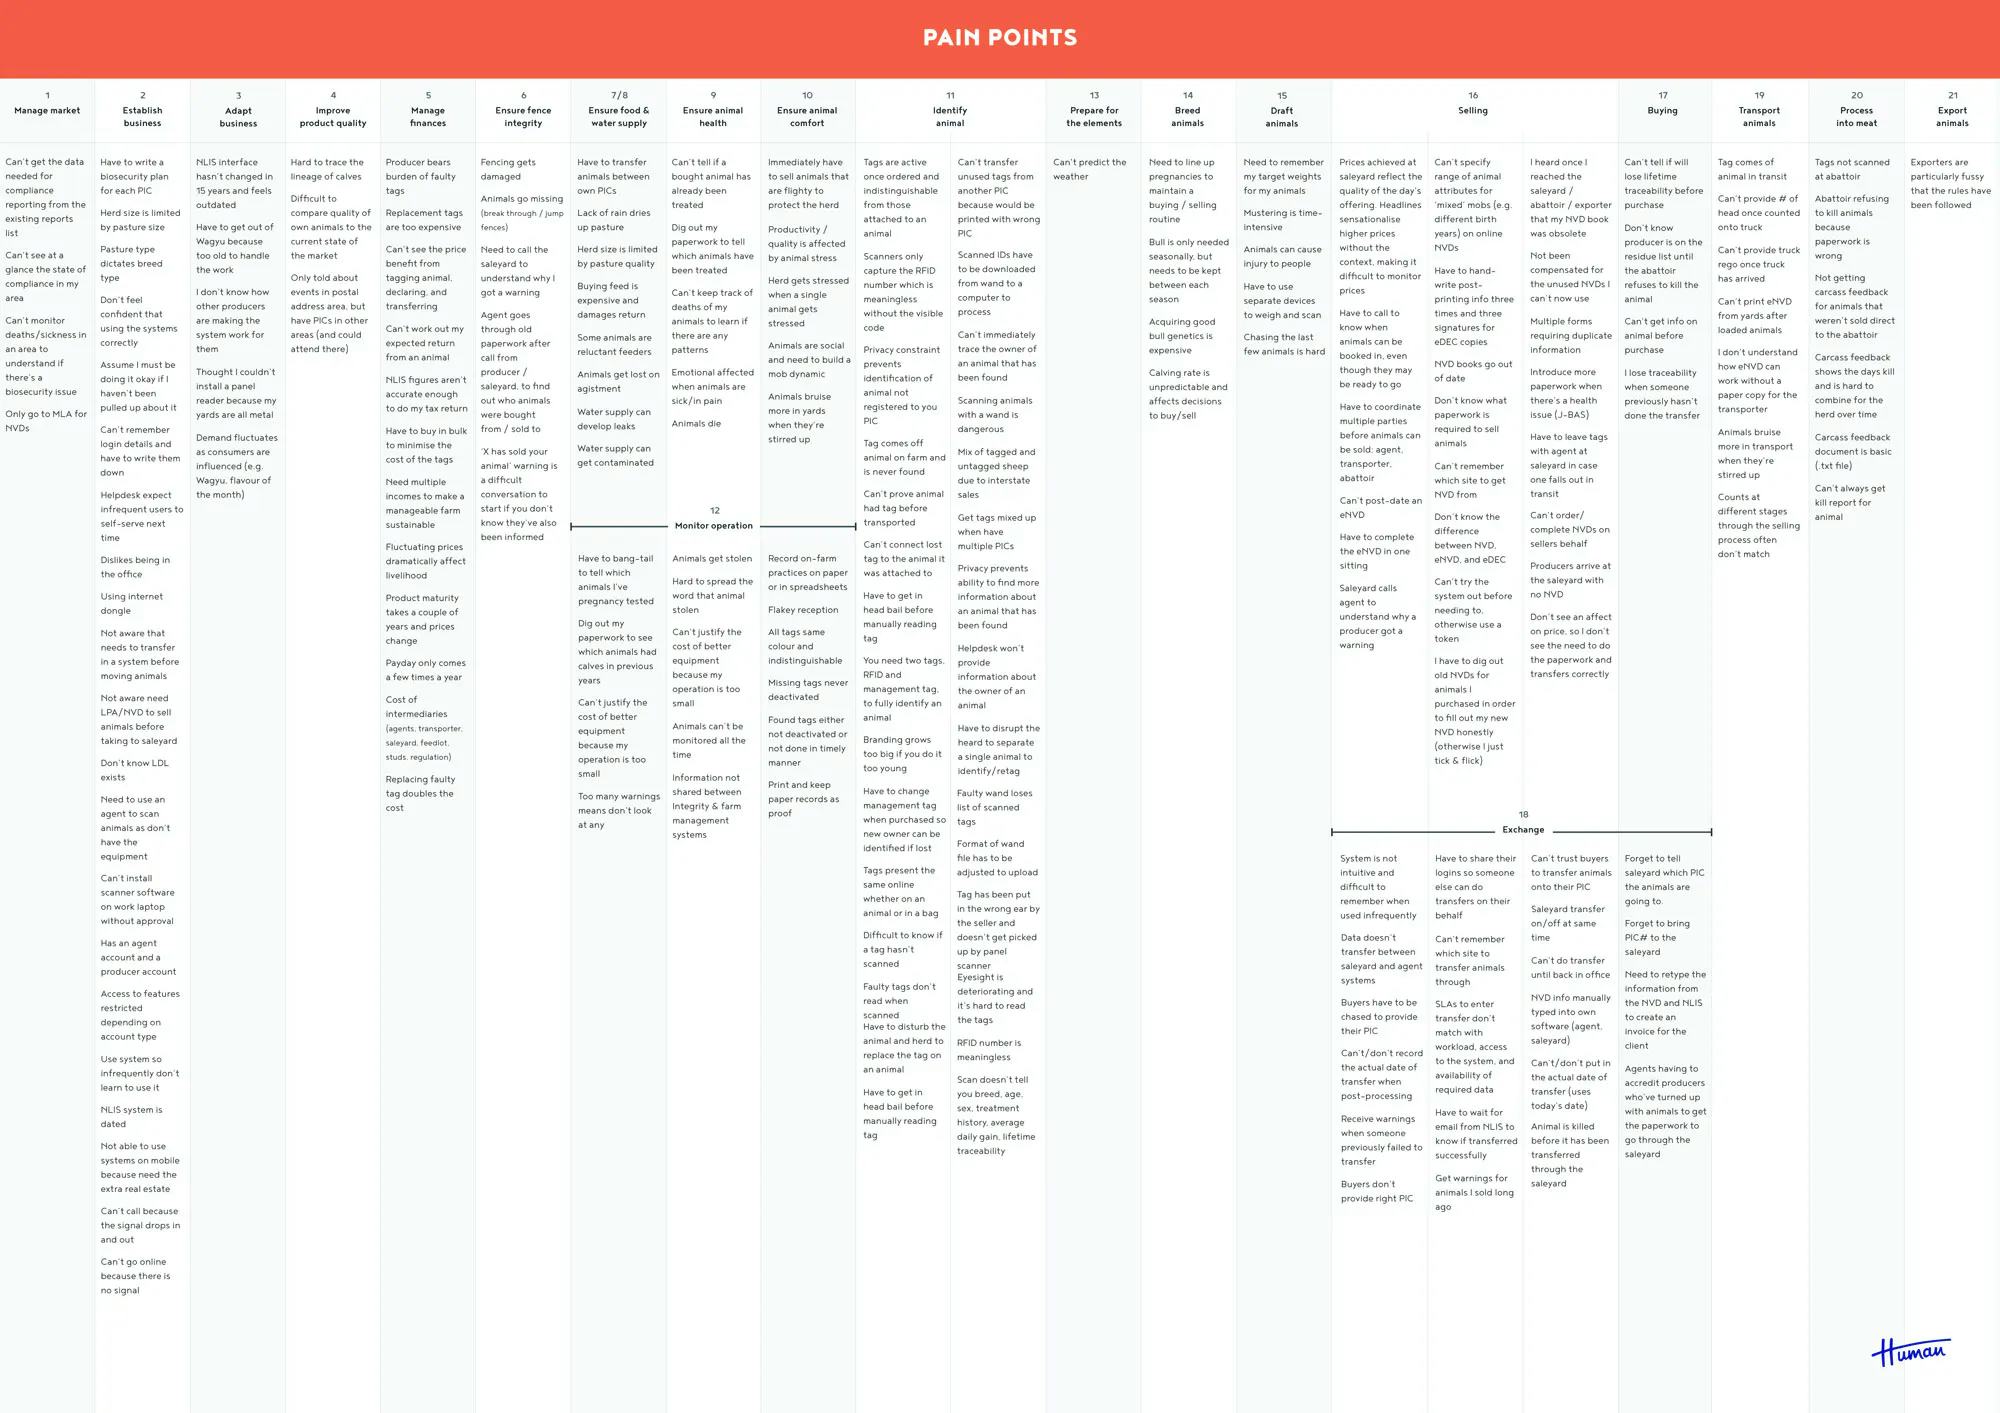
To ensure that we and all of our team members fully understood the complexity of the livestock systems we were looking to digitise, we added a fifth stage into our usual Hello Human process for this particular project. This was to create an interactive map of the process; to show all team members the entire end-to-end process of raising and selling livestock.
We transformed our findings from the research done and interview conducted into this interactive map, so that everyone could visually see all stages of livestock production. Due to the map being interactive anyone viewing it could also click on any stage and see all the information in a digestible format.
This tool was not only incredibly useful to ensure all team members understood the process, but to also show how complete our data was, onboard new employees, and run design sprints.
Stage 6: Running design sprints
Running design sprints is a key step in the design thinking and research process. The goal here is to map out the vision of a single system to transport and sell livestock. We took inspiration from the book Sprint by Jake Knapp. Although the book details 5 days to run a design sprint session, the Hello Human had already completed a lot of the research work required and opted to condense everything down to 1 day and ran a team-wide 1-day design sprint.
Stage 7: Concept testing
Our next crucial step in this process was to run a Crazy 8's session. For anyone unfamiliar with the concept, it’s where you sketch a new idea every minute for 8 minutes. If it sounds fast-paced, it is! This task is very specifically designed to push the teams’ boundaries to go way past our first, second, or even third idea. This forces far more creative thinking and problem-solving.
Every team member then documents their 8 ideas onto post-it notes. Our team then goes around and votes for the concepts that could make the most significant impact. These ideas were then voted on again and documented as the chosen features for prototyping. It’s a Hello Human favourite to stretch our creativity and problem-solving capabilities.
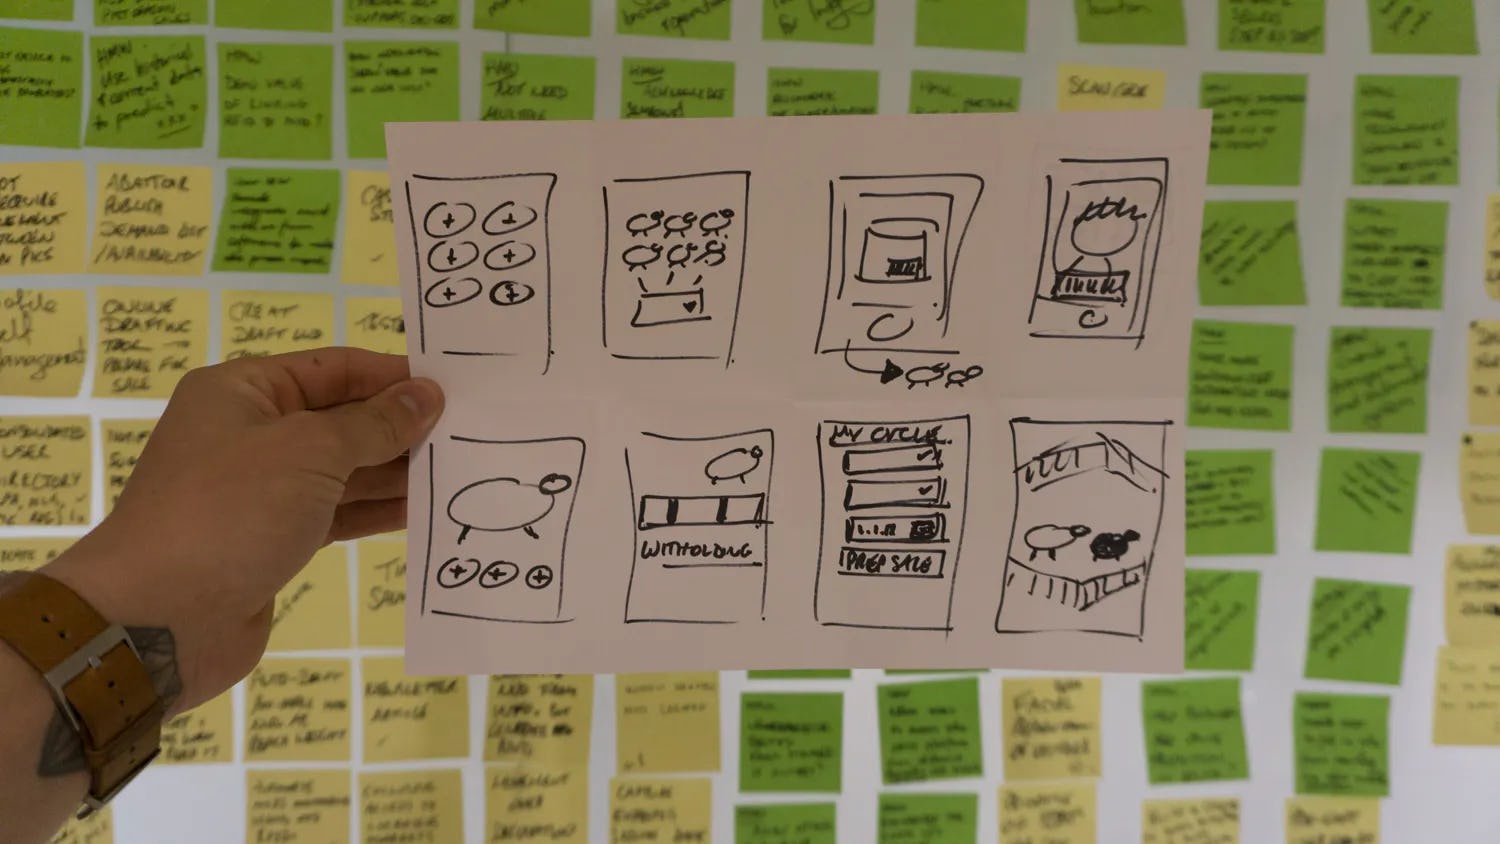
Stage 8: Prototyping
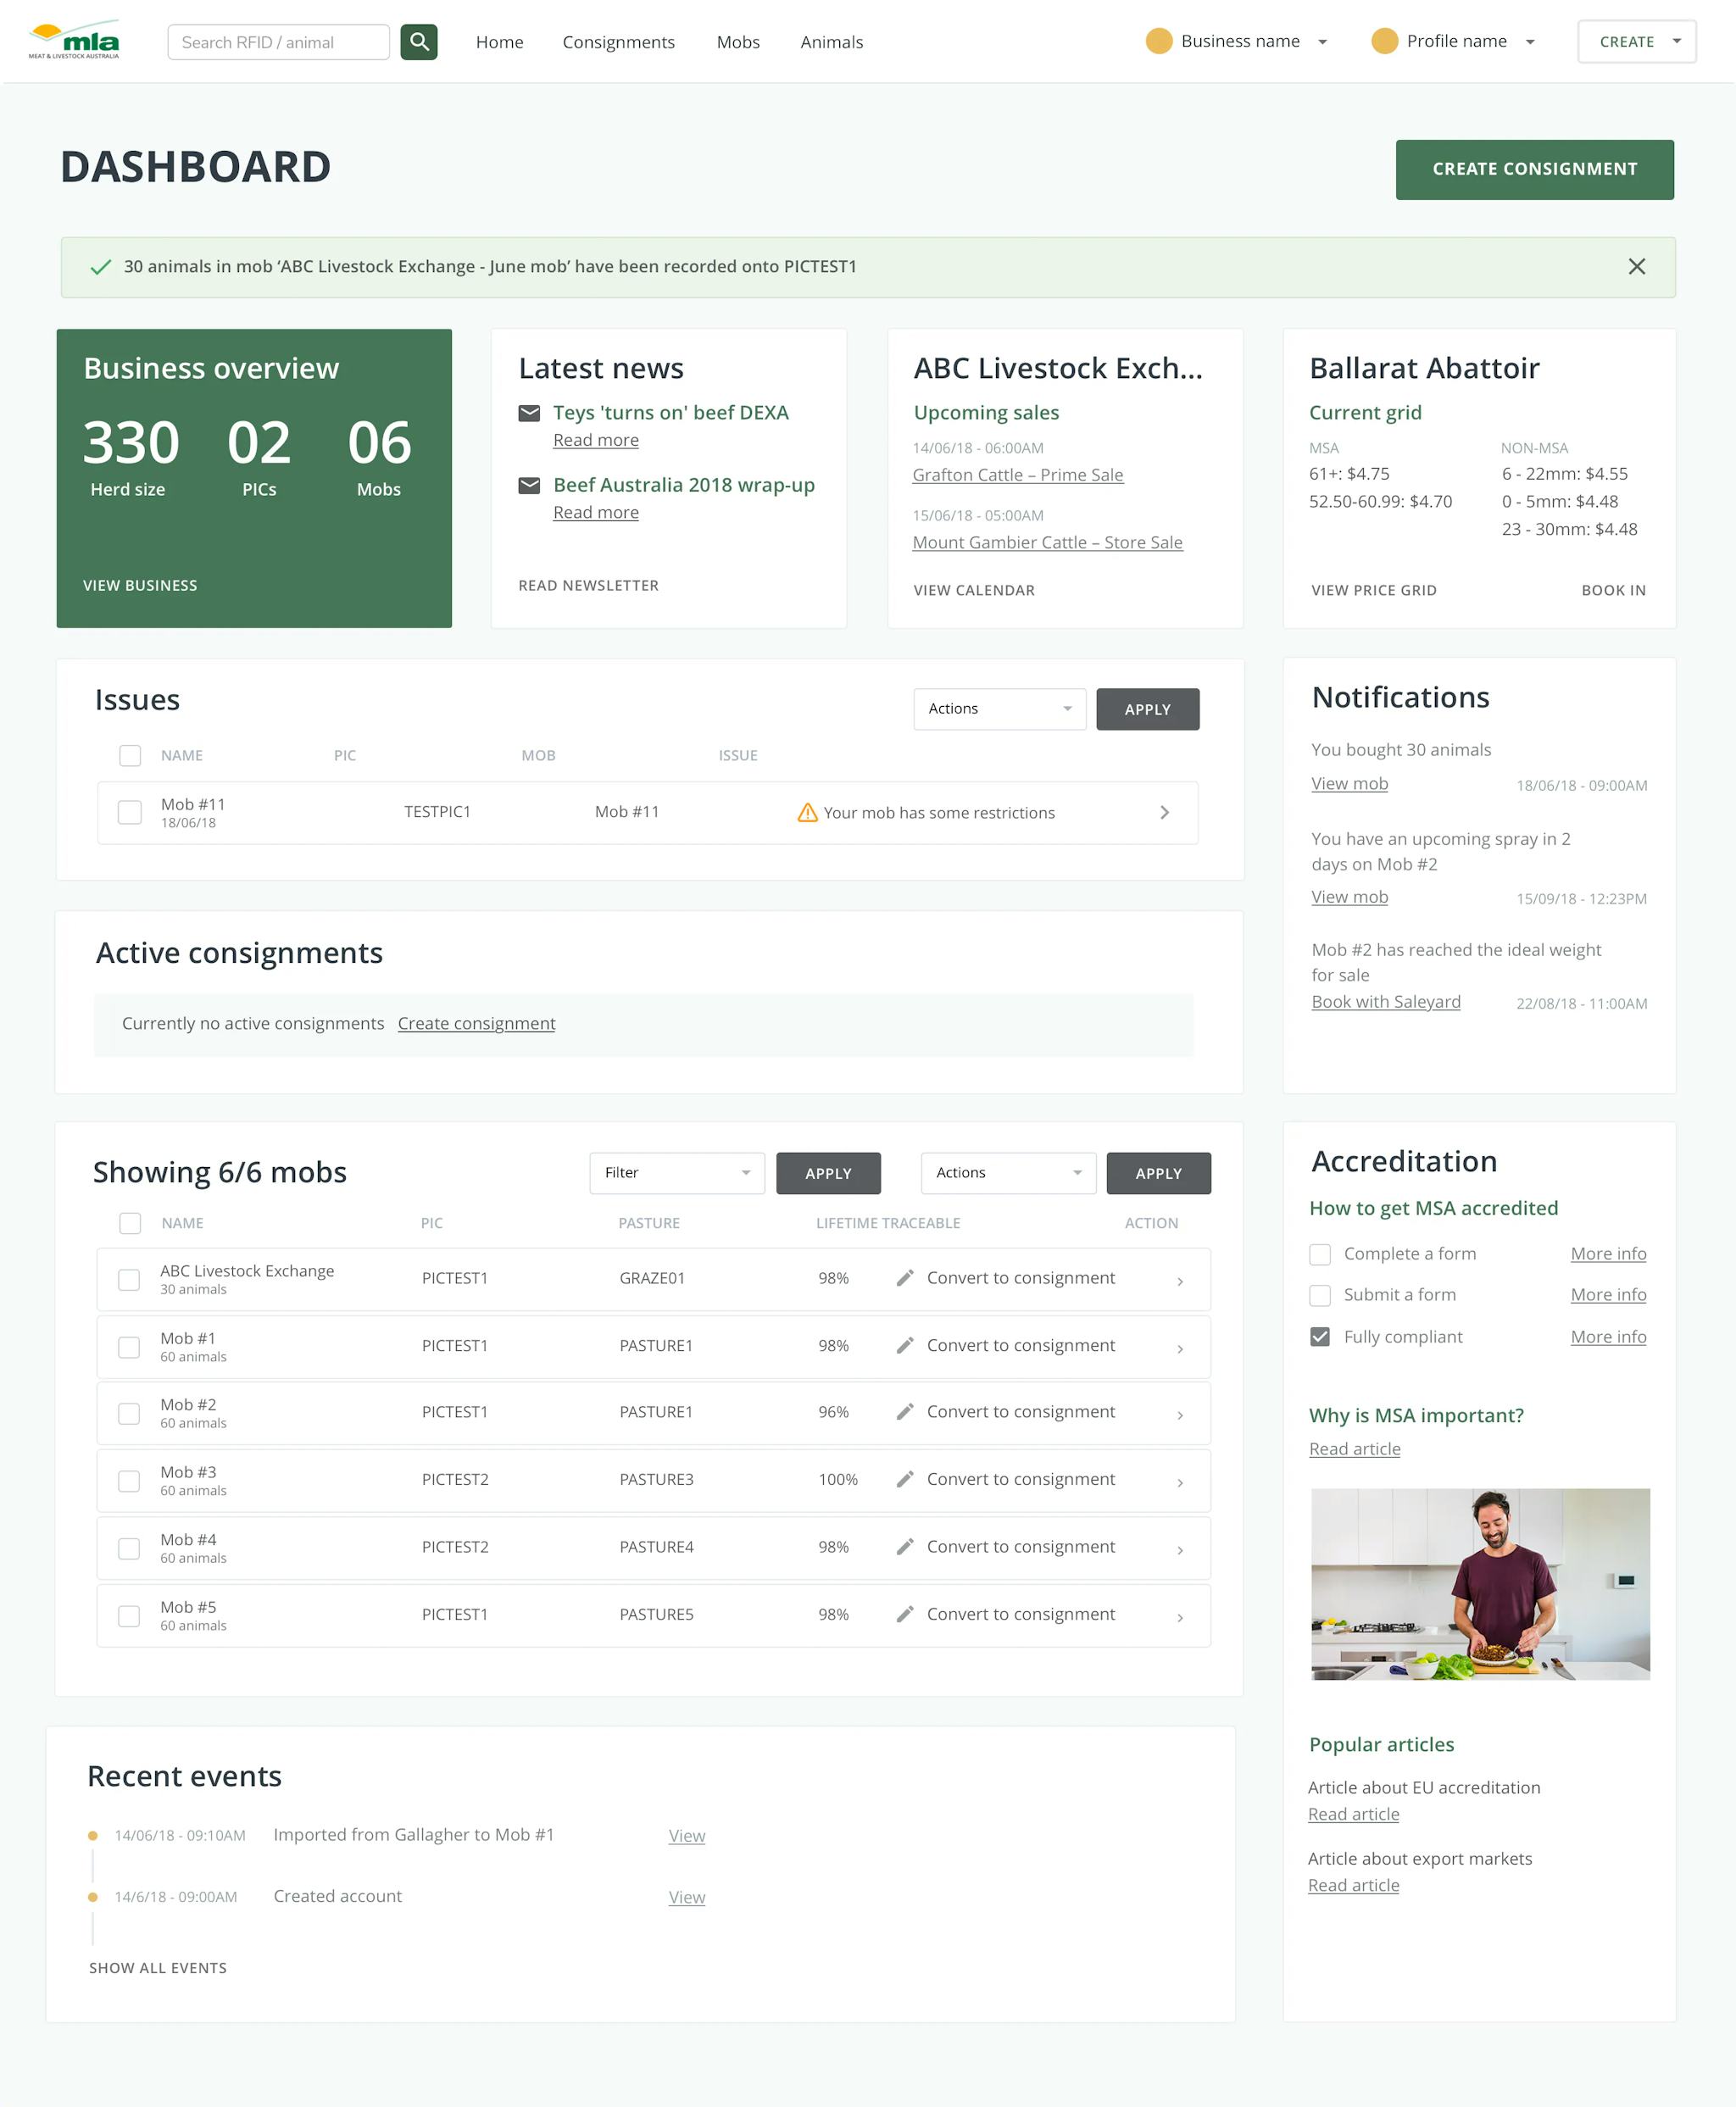
Our Hello Human team moved on to the next stage and worked in Sketch to design wireframes of the concepts for further exploration. The ideas designed in Sketch were simple visual references to showcase what could come from the design sprint. The designs will be presented to the board to obtain buy-in for future work (but more on this in Part 2).
Interested in knowing more about the design thinking and research process itself, or how our Hello Human team can make your life easier through innovative digital design? Don’t hesitate to reach out to a team member for a chat today.